- Tax Planning
- Investments 1: Before you Invest
- Investments 2: Your Investment Plan
- Investments 3: Securities Market Basics
- Investments 4: Bond Basics
- Investments 5: Stock Basics
- Investments 6: Mutual Fund Basics
- Investments 7: Building Your Portfolio
- Investments 8: Picking Financial Assets
- Investments 9: Portfolio Rebalancing and Reporting
- Retirement 1: Basics
- Retirement 2: Social Security
- Retirement 3: Employer Qualified Plans
- Retirement 4: Individual and Small Business Plans
- Estate Planning Basics
Calculate Risk-Adjusted Return Performance
As you are analyzing the returns on the various assets in your portfolio, how can you tell how well you are doing? Is only the total return on each asset important, or should you consider other factors in determining whether each of your assets performed as well as it should have? How do you determine whether a portfolio manager is generating excess returns (returns that are higher than the portfolio’s benchmarks)? Is performance just a matter of high returns, or should you also be concerned about risk?
It is important to understand risk in managing portfolios. For example, two portfolios have the same 5-percent annual return. One is 100-percent invested in Treasury Bonds, and the other is 100-percent invested in small-capitalization stocks. With the Treasury portfolio, there is very little volatility in returns. With the high-growth portfolio, there is very little risk or volatility of returns. With the small-capitalization portfolio, there is extreme volatility. Clearly, risk matters.
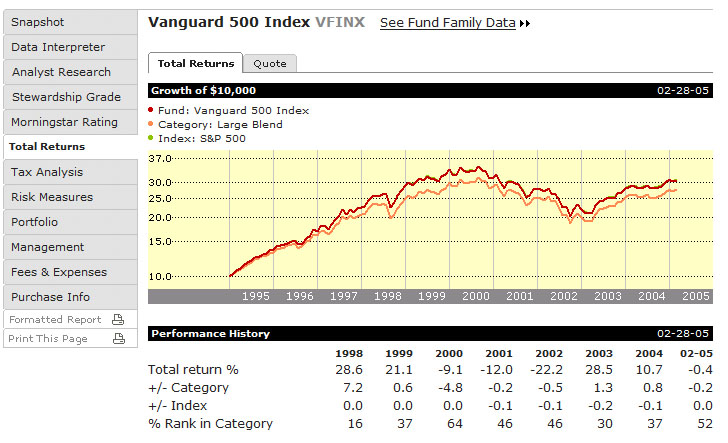
One of the easiest and most popular ways of comparing risk is to compare the return rates of investment funds that have similar investment objectives and similar risk characteristics. For example, all large-capitalization “blend” mutual funds are grouped in the same category, small-capitalization “growth” mutual funds are grouped in another category, and all international stocks are grouped in a third category. The average return on each fund within a specific category is calculated, and each fund is given a percentile ranking depending on its relative performance within the category and within the same time period. Generally, the lower the percentile ranking (the range is between one and one hundred), the better the performance. If your fund’s percentile ranking is sixteen, that fund is in the top 16 percent of all mutual funds within its category. To see an example of a mutual fund and its relative ranking, see Chart 26.1. Chart 26.1 shows a screen shot from www.Morningstar.com. The chart shows the fund’s total return, the fund’s return less the category average, and the return less the index return. The “percent rank in category,” shows the fund’s percentile ranking for each year that the fund has reported its performance to mutual fund reporting companies.
Chart 26.1 Performance History

Comparing the managers of similar investment groups is another useful first step in evaluating performance, but the numbers may be misleading. Some managers may concentrate on very narrow sub-groups of their investment objectives, so portfolio characteristics may not be comparable. For example, in the large capitalization “blend” category, some managers may concentrate on high beta (more volatile) stocks, while others may take a more balanced approach. In addition, some managers may change style. Managers may watch the performance of growth stocks versus value stocks and invest in the style that is currently performing the best. Style analysis has become increasingly popular in the investment industry.
There are a number of accepted ways of measuring portfolio performance: the most widely used measuring tools include the Sharpe measure, the Treynor measure, and the Jensen measure. Each of these measures means little in and of itself; rather, these measures have meaning when compared to the measure of the relevant market benchmarks.

